Account Holdings is a list of stocks, mutual funds and bonds currently held in your team's portfolio.
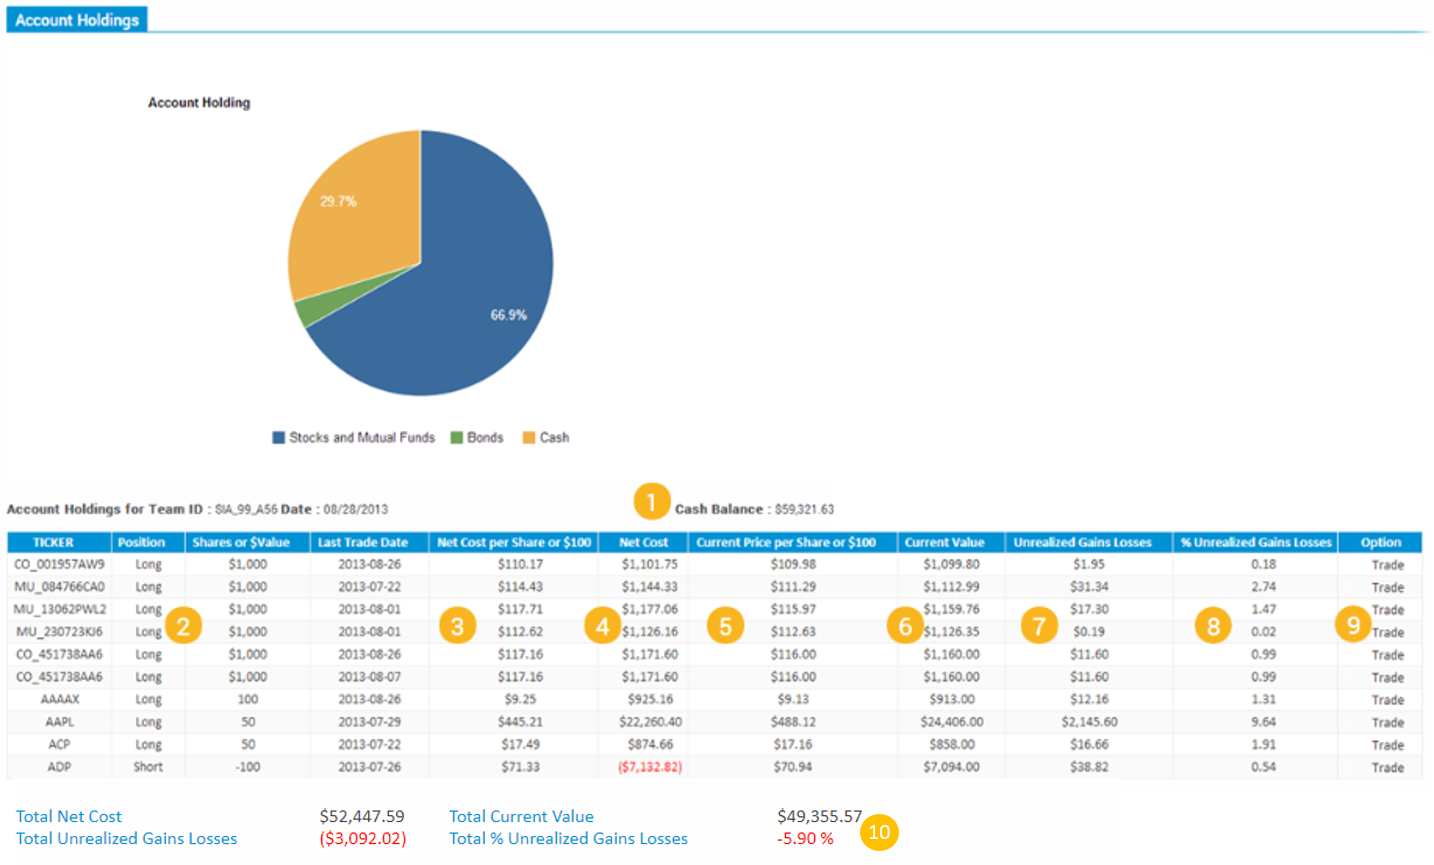
The Cash Balance is the amount of cash your team has available. This includes dividends, interest, and proceeds from the sale of stock, mutual funds, and bonds. If your Cash Balance is a negative number, it will also include the money you have borrowed on margin.
Return to TopThe first four columns provide information about the trade, including the ticker symbol, the type of position (long or short), the number of shares or dollar value, and the last date a trade was entered for that security. Bonds are identified by a 12-digit ticker symbol. Shares or $ Value indicates the number of stock or mutual fund shares purchased or dollar value of bonds purchased. Treasury bonds trade in increments of $100. Municipal and corporate bonds trade in increments of $1,000.
Stocks held in a short position will have a minus sign in front of the number of shares, indicating that is the number of shares owed to the broker.
Return to TopIn the long position, the Net Cost Per Share or $100 is the money spent on each share of stock or mutual fund.(or each $100 for bonds) plus commission. i
Formula:
Net Cost Per Share or $100 = Cost of Trade / Number of Shares
Cost of Trade = (Price per Share x Number of Shares) + commission
Treasury bonds: accrued interest = $ value of bond x (annual interest rate / # annual payments) x (# of days elapsed/ # of days in period for that coupon).
Corporate & Municipal bonds: accrued interest = $ value of bond x annual interest rate x (# of days elapsed / 360) where no month can exceed 30 days when determining "# of days elapsed".
In the long position, the Net Cost is the cost of purchasing the stock or mutual fund, including commission fees. When you buy a bond, you also pay for the accrued interest plus commission of 1%. A $4,000 bond with a price of $99.50/$100 will cost you: (40 x 99.50 = $3,980) + accrued interest + commission.
Current Price is the previous trading day's closing price of stock or the current value of bonds and mutual funds.
Return to TopFor stocks and mutual funds: Current Value = number of Shares x Current Price
For bonds: Current Value = $ Value per 100 x Current Price Per $100
Unrealized Gains or Losses reflects the projected profit or loss if you were to sell the security now. Unrealized Gains and Losses will change each day as the current price of the security changes. A gain or loss will only become realized when the position is closed (i.e. sold or short covered). It will then appear in the Gains and Losses section of the portfolio.
Formula: Unrealized Gains (or Losses) = Current Value - Net Cost
Return to TopThe % Unrealized Gains or Losses is the percent that you have gained or lost on a trade. This number will change each day as the Unrealized Gain or Loss changes.
Formula: % Unrealized Gains or Losses = Unrealized Gain (or Loss) of the security / Net Cost for the security x 100.
The Total row shows the total Unrealized Gains (or Losses) in dollars and percentage.
Formulas: Total Unrealized Gains (or Losses) = sum total of all Unrealized Gains and Losses
Total Unrealized Gains (or Losses) % = sum total of all Unrealized Gains and Losses / sum total of the Net Costs x 100.
You may see an entry on this page that has zero listed as the cost and INF will appear in the % Unrealized Gains or Losses column. This indicates that a corporate action has taken place that added a new security to the portfolio. If it involved receiving shares of a stock to replace shares of another stock, there will be a corresponding entry on the Gains and Losses page. Teams will need to compare the loss shown on that page with the unrealized gain on the Account Holdings page to determine the true gain or loss. The Transaction History page will show that no dollar amounts were involved in this exchange.
You can trade any security in your Account Holdings by clicking on the Trade button located in the Option column. This will take you directly to the trading screens and auto-populate the ticker of the security you have selected for trading.
Return to TopA ticker with a Net Cost of zero with INF (meaning "infinity") as its % Unrealized Gains/Losses indicates the shares associated with this ticker were derived from a corporate action. This can be as simple as a change of a stock symbol name or as complex as a ticker derived from a forward or reverse split. Company mergers and stock splits are the two most common corporate actions. You will be notified in advance of such actions when possible. Usually corporate actions are detailed in company press releases and you are encouraged to keep an eye on the company news for your held tickers as well.
If a corporate action replaces currently held shares of stock with shares of another stock or stocks, corresponding entries can be found on the Transaction History page. Teams should compare the original cost of the position from Transaction History and compare to Current Value on the Account Holdings page to determine the true gain or loss.
Copyright © 2014 SIFMA Foundation.
All rights reserved. Provided for educational purposes without
warranty expressed or implied.